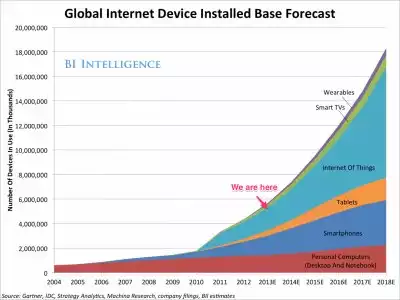
Nearly two decades ago, consumer demand for internet access was driven primarily by consumers using personal computers. These days, smartphones tend to drive accounts. In the future, sensor connections are likely to dominate growth. That is one example of what, a decade ago, we started to call the post-PC era. In terms of shipments, other computing devices surpassed shipments of PCs in 2010 or 2011.
The implications for internet access providers are significant, in consumer markets, important, but less so, in enterprise markets. The reason is that consumers do most of their computing or internet-app activities on smartphones and other devices, not PCs. PCs still are the workhorse for enterprises.
Global Mobile Data Traffic, 2016–2021
| |||||||
2016
|
2017
|
2018
|
2019
|
2020
|
2021
|
CAGR
| |
By Application Category (TB per Month)
| |||||||
Web, data, and VoIP
|
2,153,676
|
2,938,884
|
3,779,988
|
4,674,801
|
5,538,615
|
6,434,681
|
24%
|
Video
|
4,375,000
|
7,225,123
|
11,415,329
|
17,564,661
|
26,067,686
|
38,148,326
|
54%
|
Audio streaming
|
559,999
|
843,394
|
1,193,711
|
1,620,662
|
2,103,876
|
2,674,183
|
37%
|
File sharing
|
151,874
|
258,617
|
403,273
|
592,352
|
820,954
|
1,102,867
|
49%
|
By Device Type (TB per Month)
| |||||||
Non-smartphones
|
109,505
|
137,852
|
169,955
|
199,173
|
236,257
|
269,189
|
20%
|
Smartphones
|
5,887,078
|
9,328,403
|
14,076,023
|
20,710,278
|
29,484,004
|
42,017,358
|
48%
|
Tablets and PCs
|
1,085,059
|
1,514,749
|
2,040,640
|
2,681,672
|
3,457,800
|
4,439,720
|
33%
|
M2M
|
157,998
|
284,415
|
505,292
|
861,025
|
1,409,949
|
2,224,543
|
70%
|
Other portable devices
|
910
|
599
|
391
|
328
|
432
|
659
|
-6%
|
By Region (TB per Month)
| |||||||
North America
|
1,411,021
|
2,000,301
|
2,776,564
|
3,753,177
|
4,838,494
|
6,397,092
|
35%
|
Western Europe
|
736,377
|
1,084,396
|
1,534,120
|
2,167,831
|
3,019,843
|
4,189,615
|
42%
|
Asia Pacific
|
3,109,117
|
4,900,007
|
7,434,743
|
11,048,030
|
15,911,056
|
22,845,908
|
49%
|
Latin America
|
449,944
|
688,890
|
1,023,408
|
1,475,498
|
2,078,670
|
2,898,651
|
45%
|
Central and Eastern Europe
|
923,803
|
1,396,079
|
2,013,989
|
2,836,076
|
3,886,561
|
5,252,334
|
42%
|
Middle East and Africa
|
610,286
|
1,196,346
|
2,009,476
|
3,171,864
|
4,853,817
|
7,367,869
|
65%
|
Total (TB per Month)
| |||||||
Total Mobile Data Traffic
|
7,240,550
|
11,266,018
|
16,792,300
|
24,452,476
|
34,588,442
|
48,951,469
|
47%
|
Source: Cisco Mobile VNI, 2017
Still, some eight billion devices were connected to mobile networks alone in 2016, and smartphone traffic (as distinct from the number of used devices) dwarfs PC traffic.
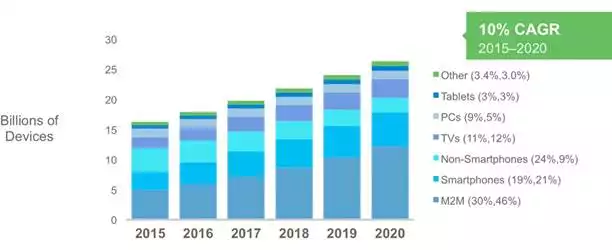
The point is that smartphones now drive traffic, while machine-to-machine communications and internet of things likely will drive device growth and internet access connections.


No comments:
Post a Comment