Friday, October 30, 2020

When are Lagging Speeds Not a Problem?

New tests of typical 5G speeds by Opensignal suggest typical U.S. 5G speeds are about 14th globally. Many will see this as a problem, but it is a problem that is destined to disappear. U.S. 5G networks have launched their coverage networks using low-band spectrum, where most other networks have used mid-band spectrum. 


source: Opensignal 


Capacity coverage supplied by use of millimeter wave spectrum is still limited by the extent of small cell networks under construction by AT&T and Verizon, as well as T-Mobile’s mid-band network. 


Over time, both mid-band and millimeter wave assets will proliferate, boosting speeds. 


That noted, a ranking about 14th globally is quite standard for U.S. communication networks. 


One of the most-recurring stories about U.S. communications infrastructure deployment, app use or performance is that it “lags” what other countries achieve, especially in the early days of deployment. But even long-term indices show “lagging” U.S. performance. There’s a good reason for those trends. 


In the past, it has been argued that the United States was behind, or falling behind, for use of mobile phones, smartphones, text messaging, broadband coverage, fiber to home, broadband speed or broadband price.


Consider voice adoption, where the best the United States ever ranked was about 15th globally, for teledensity (people provided with phone service). A couple of thoughts are worth keeping in mind. First, large countries always move slower than small countries or city-states, simply because construction of networks takes time and lots of capital. 


The bottom line is that it is quite typical for U.S. performance for almost any important new infrastructure-related technology to lag other nations. It never matters, in the end. 


Eventually, the U.S. ranks somewhere between 10th and 20th on any given measure of technology adoption. That has been the pattern since the time of analog voice, and largely because of huge rural or uninhabited landmass, which raises the cost and reduces the coverage of networks. 


We often forget that six percent of the U.S. landmass is where most people live. About 94 percent of the land mass is unpopulated or lightly populated. And rural areas present the greatest challenge for deployment of communications facilities. 


The point is that outcomes are what matter. What matters with the application of technology is what impact can be wrung from the investments.

U.S. Mobile Data Speeds Grow Logarithmically Since 2010

Over the last decade, average (or perhaps typical) mobile data speeds have grown logarithmically, according to data compiled by PCmag. I cannot tell you whether the graph shows median or mean speeds, but the point is that, assuming the same methodology is used for all data, the logarithmic trend would still hold. 


source: PCmag 


Wednesday, October 28, 2020

North America 5G Subscriptions 48% of Total Phone Accounts by 2025

The importance of the internet of things connections supported by mobile networks can be seen in just a few statistics. The GSMA predicts that 5G mobile phone subscriptions will reach about 48 percent of total mobile accounts by about 2025. 


source: GSMA 


That translates into about 205 million discrete users of 5G in North America. Total users will number about 342 million by 2025, while total accounts are higher because of active multiple subscriber identity modules, bringing the total of North America accounts to 426 million. 


Internet of Things connections, meanwhile, will number about 400 million by 2025. In other words, more than half of all mobile connections in North America will consist of IoT accounts by 2025.

Tuesday, October 27, 2020

What is Driving 5G ARPU Upside?

If there seems to be an contradiction between the statements “most 5G launches are still lacking the use cases needed to truly highlight the value of 5G” and “early rollouts have emphasized and underlined the importance of the consumer market when it comes to monetizing 5G,” then something other than “new use cases” is driving revenue and “average revenue per user” trends.


One might argue that “faster access” is the difference. But in some markets--especially where 5G relies on low-band spectrum for coverage and millimeter wave for capacity--that advantage is not so meaningful. In countries where 5G rolled out using mid-band assets, the speed differentials are clear, compared to 4G. 


But it is arguable whether the faster speeds have dramatically changed user experience. 


Still, there are signs that 5G adoption has boosted ARPU. Some might point to higher data consumption as evidence of ARPU change, but, as always, usage and revenue are not related in any linear way. 


In South Korea, close to 30 percent of the country’s 5G mobile data traffic was created by only 11.3 percent of subscribers, Ericsson notes. 


As always, when multiple changes are at work, it is hard to pinpoint the specific contribution 5G usage plans are playing.  South Korean service providers have launched premium 5G plans which have increased revenues. 


In some cases, though, the incremental revenue is gained not especially by 5G speed advances but by enhanced roaming features, loyalty rewards, multi-device features and handset insurance that add value and revenue. 


South Korean telcos also are offering 5G-rich apps, including augmented reality 3D shopping, virtual reality cloud-gaming and other AR and VR apps that are bundled with 5G. 


So the issue is whether it is the actual speed increase supplied by 5G, or lower latency that has spurred adoption, or whether it is the wrap-around of other features that actually is driving the revenue upside. 


In the U.S. market, for example, some suppliers market 5G as a feature of unlimited usage plans that cost more than defined-usage plans. In other words, higher-cost plans offering unlimited usage might reasonably be the driver for more-costly 5G plan adoption, not the specific features of 5G as such.


Wednesday, October 21, 2020

Wireless Capacity Tools Rely on Cell Radius, New, Shared Spectrum

There are just a few fundamental ways to increase wireless capacity: reduce the size of cells; allocate additional spectrum or share spectrum. All three are features of present next-generation network architectures. 


In the U.S. market, for example, already-planned moves will increase mobile operator spectrum by an order of magnitude. 

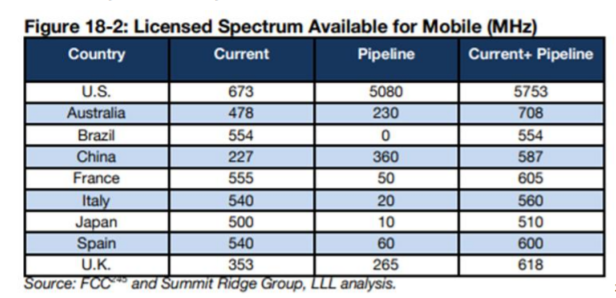
source: Summit Ridge Group 


The movement to small cells is partly a result of physics, partly economics and partly a matter of government policy and enterprise choices. As wireless and mobile communications move to higher frequencies, coverage areas decrease. That forces the use of smaller cell sites. 


Economics plays a role as well, since outdoor cell sites using millimeter wave frequencies will not be able to reach inside buildings. Government policy plays a role by authoring the use of spectrum for both licensed, shared and unlicensed uses by private network operators. Enterprises also make choices to build and use private networks using 4G or 5G platforms. 


source: Commerce Spectrum Management Advisory Committee 


Along the way, we are redefining our notions of frequency bands, as we have periodically revised our definitions of “broadband.” In pre-internet days, the formal definition of “broadband” was any data rate of 1.544 Mbps or higher. These days we routinely change the functional definition, with some minimum definitions based on the 25 Mbps downstream capability. 


As a practical matter, fixed network access speeds can routinely run between 100 Mbps to 200 Mbps. In September 2020, for example, U.S. typical fixed network speeds were 161 Mbps and mobile access speeds averaged 47 Mbps. Typical fixed network speeds in Singapore that same month were 227 Mbps, about 210 Mbps in Hong Kong, 175 Mbps in Thailand and 173 Mbps in France, for example. In each case, half of actual experienced speeds were higher than average, while half were lower than average. 


source: U.S. White House 


Spectrum sharing is the latest tool used to increase wireless network bandwidth, both mobile and fixed; licensed and unlicensed. 


In addition to 4G and 5G spectrum sharing, where a mobile operator can use both 4G and 5G capacity to support devices and users, spectrum sharing allows new users to operate in licensed bands held by others and supports use of both licensed and unlicensed spectrum by mobile devices and users. 


In essence, spectrum sharing is part of a broader move to virtualize network and computing operations, as can be seen in cloud computing, network functions virtualization and software defined networks. All those instances create independence between network elements or devices and the software and computing functions used by those machines. 


Spectrum sharing matters because spectrum is a scarce asset, because capacity demand is growing very fast, because shared spectrum reduces the cost of using spectrum and also increases the effective supply of capacity, faster than would be possible if airwaves were repurposed and existing users moved to new bands. 


It has been estimated that  the value of licensed U.S. mobile spectrum is $500 billion, for example. Likewise, it has been estimated that the value of U.S. Wi-Fi spectrum alone represents $140 billion in value.


To be sure, spectrum sharing also introduces a new element of business model uncertainty, because spectrum sharing can replace a large measure of scarcity with a large measure of abundance.


And abundance means lower value for licensed spectrum, even as it increases the range of sustainable business models that can be built on spectrum.


Nearly all of the most-useful communications spectrum already has been allocated, and much spectrum is inefficiently used. Today, the U.S. government, for example, possesses almost 60 percent of radio spectrum and possesses over half—1500 MHz—of the valuable 300 MHz to 3 GHz spectrum useful for terrestrial wireless and mobile communications.


Much of that spectrum is lightly used or even not used. At a time when most observers believe people, organizations and businesses will need vastly more Internet and communications capacity, that is a waste of scarce resources. Spectrum sharing increasingly is seen a way to protect legacy users but make more efficient use of radio frequency resources. 


Spectrum sharing now is practical because we are able to apply cheap and sophisticated signal processing to communications tasks. As a result, virtually all communications spectrum can be used more efficiently and effectively.


Cheap and sophisticated signal processing allows commercial use of millimeter wave spectrum (3 GHz to 300 GHz) for the first time. The same advances allow us to use existing spectrum more efficiently, moving beyond simple frequency or spatial separation.


Those methods work, but also create fallow resources. Since nobody but the licensee can use the capacity, when the licensee is not using spectrum, nobody else can use it, either. In some cases, as in the United Kingdom and United States, as little as 10 percent of spectrum gets used. In other cases, none of the capacity is used.


Two fundamental approaches now are feasible to allow many users to share capacity without causing interference to existing licensed users, but also vastly expanding the amount of capacity available to support communications and apps.


Devices themselves, or databases, are able to sense or predict where interference would occur, and then shift access operations to non-interfering frequencies or channels. Cognitive radio is an example of the former approach; databases an example of the latter approach.


Spectrum sharing is the simultaneous usage of a specific radio frequency band in a specific geographical area by a number of independent entities.  Simply, it is the “cooperative use of common spectrum” by multiple users.


Spectrum sharing also can take many forms, coordinated and uncoordinated. Coordinated forms include:

  • capacity sharing between business entities (roaming, wholesale, pooling of assets)

  • TV white spaces (database determines what you may use, when and where)

  • spatial sharing between business entities (you use here, I use there)

  • priority sharing between entities (I have first rights, you have secondary rights) Licensed shared access or authorized shared access are examples

  • license assisted access (bonding of mobile and Wi-Fi assets)

  • cognitive radio (devices determine how to avoid interference)


Uncoordinated forms of access historically is best illustrated by Wi-Fi.


The arguably more important forms of spectrum sharing use new technology to intensify the use of existing spectrum, such as licensed shared access (LSA) that allows many users to share a specific block of spectrum.


The concept is to free up capacity quickly by allowing commercial users access to currently-licensed spectrum on a secondary basis, while licensed users continue to retain priority use of their spectrum.


The advantage is that such sharing avoids the huge time and expense of relocating existing users so other users can move in.


Under the licensed shared access approach, additional users can use the spectrum (or part of the spectrum) in accordance with sharing rules that protect incumbents.


Spectrum sharing directly affects the future of telecommunications and all businesses built on the use of wireless communications. Spectrum sharing also indirectly affects all other potential alternative means of communications.


5G Users Consume 1.7 to 2.7 Times More Mobile Data Than 4G Users

Faster internet access speeds lead to higher data consumption. In September 2020, for example, 5G customers consumed as much as 2.7 times more mobile data than did 4G customers, according to Opensignal. 

source: Opensignal 


In the past, observers have suggested that the reason for the correlation is that higher speeds lead to a more-pleasant or useful experience, which increases willingness to spend time online, or using mobile internet. The other explanation has been that, with higher speeds, users can get more done in the same amount of connection time, and so increase page views, for example. 


Time spent with online media also has increased over time, which also increases data consumption. Also, the way content now is supported (lots more video advertising, for example) also increases the amount of data consumed in any single session, compared to what was the norm several decades ago. The number of objects per page has grown steadily, as well. 


As consumption of video entertainment has become more common, an additional explanation is that viewing is more likely to happen using higher-resolution modes, which, by definition, lead to higher data consumption. 


Opensignal suggests that, “by having a better experience, users consumed more content on their smartphones, or similar amounts of content at higher quality and resolution.”


“In some cases, 5G users might even be prone to use their smartphones for tethering as they might find their 5G connection is now multiple times faster than their fixed home broadband solution,” Opensignal notes.


Monday, October 19, 2020

Early Work on 6G is About On Schedule

It does seem early for technologists and researchers to be talking about 6G, as 5G has just begun commercial deployment. But mobile generations are launched every decade, and history suggests the development process actually does take 10 years or more. It took 15 to 17 years for 2G to be developed and commercialized.


Both 3G and 4G took 10 to 17 years, as did key applications enabled by 2G, 3G and 4G. Similarly, early work on 5G began about 2008. 


source: BCG 


It does seem early to be thinking or working on 6G. But, based on history, that is not unusual at all.


Sunday, October 18, 2020

Which Demand Curve for 5G? 3G or 4G?

The general consensus now seems to be that 5G will be adopted about as fast as 4G. That said, one might argue that adoption curves for 2G and 3G were similar, while 4G had a different--and faster--early adoption pattern. The issue is whether 5G adoption curves will look more like 3G or 4G.


Even in the same country, adoption rates of 2G, 3G and 4G have varied. Generally speaking, 2G adoption happened at a faster rate than 3G in Italy, France, Germany and the United Kingdom. The adoption rate for 4G was faster or slower than 3G in those four countries. 

source: Jha, Saha


Japanese consumers adopted faster, in every generation. U.S. consumers were the slowest to become 2G customers, but among the fastest to adapt to 4G. 

source: Recon Analytics 


Expected 5G uptake in several West European countries might also show some differences from past patterns, according to Ashutosh Jha, Indian Institute of Management Calcutta professor, and Debashis Saha, professor at the Indian Institute of Management Calcutta. 

Compared to 2G, consumers in various countries seem to have placed different value on 3G and 4G services


source: CTIA, ITU


On the other hand, the total number of customers has increased with every successive mobile generation. 


But it arguably remains difficult to predict too much about early adopter behavior in specific countries when a next-generation mobile network launches. As happened in some markets early in the deployment of 4G, uptake was limited where 4G speeds were insufficiently faster than 3G, or were inconsistently faster. 


But 4G generally was adopted faster than 3G, presumably because higher 4G speeds made use of mobile internet apps noticeably more pleasant and useful. Also, some new apps made available in the 4G era added new value (ride sharing, turn by turn navigation, entertainment video, social media). 


Speed improvements over 4G will be obvious in some markets with lots of mid-band spectrum available. That might not be a key driver of U.S. adoption for a while, as deployment strategies using low-band spectrum will not offer much--if any--consistently faster speeds than does 4G. 


Spectrum availability also was an early concern in the early 4G era, as faster speeds require additional bandwidth, all other matters (especially cell sizes) being equal. 


Network coverage also has made a difference. Device prices and service subscription prices also have mattered.  


In some markets, perceived value was an issue. For some users, faster speed was enough. For many others, new applications were necessary. Turn-by-turn directions, video entertainment, ride sharing or social media were the necessary new experiences driving the value of 4G. 


Consumer demand also varies. U.S. consumers, for example, were slower to adopt 2G and 3G compared to consumers in other nations. That changed with 4G, when U.S. consumers generally adopted faster than users in many other countries. 


It is hard to pinpoint why the adoption curve changed so much by generation, but new applications are the likely reason.


Friday, October 16, 2020

SK Telecom, Uber Partner for Ride Sharing

SK Telecom is combining its ridesharing assets in a joint venture with Uber. SKT’s T map service currently has T Map is the largest mapping and location platform in South Korea with around 13 million monthly active users.  


T Map Taxi is the nation’s second largest ride hailing service with 200,000 registered drivers (Kakao is the biggest) and 750,000 monthly active users. The SKT business also provides other location-related services such as T Map Auto, T Map Public Transportation and T Map Parking, all of which will be continued by T Map Mobility.


Of the three primary methods of creating a position in a new market or line of business, connectivity providers can grow their business organically, partner or acquire. This is an instance of partnering that some might say follows an important rule, which is that a connectivity provider should strive to “own some of the apps flowing over the network.”


In other words, in preference to rebranding a wholesale offer from a third party, or acting as a sales agent or distributor, or supplying some input to an app or service, it is preferable to be an equity owner. That is the principle behind owning a video subscription service (linear or over the top), a content provider (film or TV studio, programming network) or other assets requiring use of the internet and an access network connection.


Between 2005 and 2014, for example, tech giant share of profits in the technology, media and telecom industries grew from 11 percent of total to 20 percent, for example. Since 2008, the trend has continued.


source: A.T. Kearney  


In a business environment where any app provider can use the internet to reach any connected user, it never will be possible for any connectivity provider to own anything more than a handful of useful and popular assets. But ownership of some assets diversifies the business model, provides revenue upside if apps are successful and usually also raises profit margins.  


Call this “moving up the stack” or “across the value chain” or “occupying new roles in the ecosystem,” the principle is the same: reliance on pure connectivity revenue streams is becoming dangerous for a growing number of big connectivity providers.


Thursday, October 15, 2020

AT&T, Ericsson to Support 4G, 5G Private Networks

AT&T and Ericsson now offer to build private 4G and 5G networks for enterprises, using the Ericsson platform and AT&T Citizens Broadband Radio Service capacity. Available from AT&T Private Cellular Networks, customers can now use Ericsson infrastructure for a localized cellular core and access network, enabled by CBRS shared spectrum.


The collaboration offers a managed services approach to building private 4G or 5G networks in industrial environments like factories and warehouses, as well as remote locations like mines, among other possible use cases. 


The move also allows AT&T a way to participate in the private 4G and 5G network revenue stream as a managed service provider, supplying design, installation, test and turn up, ongoing support for software updates, hardware support, and tier one through three support.


Support Level

Function

Support methodology

Staffing needs

Tier 0

Self-help and user-retrieved information

Users retrieve support information from web and mobile pages or apps, including FAQs, detailed product and technical information, blog posts, manuals, and search functions.

Users also use apps to access service catalogs where they can request and receive services without involving the IT staff.

Email, web forms, and social contact methods such as Twitter, LinkedIn, etc., are used to send questions and requests to upper support tiers or company personnel.

Customer forums allow users to crowdsource solutions, usually without input from company personnel.

Tier 0 requires technical and marketing resources to create, maintain, and update product information.

A development team handles web site and app creation.

Moderators are used to monitor customer forums.

Tier 1 personnel respond to requests received through email, web sites, or social media.

Tier 1

Basic help desk resolution and service desk delivery

Support for basic customer issues such as solving usage problems and fulfilling service desk requests that need IT involvement.

If no solution is available, tier 1 personnel escalate incidents to a higher tier.

Lower-level technical personnel, trained to solve known problems and to fulfill service requests by following scripts.

Tier 2

In-depth technical support

Experienced and knowledgeable technicians assess issues and provide solutions for problems that cannot be handled by tier 1.

If no solution is available, tier 2 support escalates the incident to tier 3.

Support personnel with deep knowledge of the product or service, but not necessarily the engineers or programmers who designed and created the product.

Tier 3

Expert product and service support

Access to the highest technical resources available for problem resolution or new feature creation.

Tier 3 technicians attempt to duplicate problems and define root causes, using product designs, code, or specifications.

Once a cause is identified, the company decides whether to create a new fix, depending on the cause of the problem. New fixes are documented for use by Tier 1 and Tier 2 personnel.

Tier 3 specialists are generally the most highly skilled product specialists, and may include the creators, chief architects, or engineers who created the product or service.

Tier 4

Outside support for problems not supported by the organization

Contracted support for items provided by but not directly serviced by the organization, including printer support, vendor software support, machine maintenance, depot support, and other outsourced services.

Problems or requests are forwarded to tier 4 support and monitored by the organization for implementation.

Preferred vendors and business partners providing support and services for items provided by your company.

source: bmc 


Is Sora an "iPhone Moment?"

Sora is OpenAI’s new cutting-edge and possibly disruptive AI model that can generate realistic videos based on textual descriptions.  Perhap...