Tuesday, March 31, 2020

OneWeb Heading for Bankruptcy

It is safe to say that nobody expects all the potential suppliers of low earth orbit satellite constellations will be funded, launch or succeed. OneWeb, facing funding issues, seems to be on the verge of bankruptcy, having failed to secure $2 billion in additional near-term funding. 

LeoSat, another would-be contestant, shut down in late 2019, unable to raise additional funding. 

Airbus, Virgin Group, Qualcomm, Bharti Enterprises and Grupo Salinas. But OneWeb faced deep-pocketed competitors including SpaceX’s Starlink and Amazon’s Project Kuiper

Some might argue the demise of OneWeb makes it a casualty of the Covid-19-driven recession and capital-starved market that is sure to ensue. 

AT&T 5G Might Deliver 3 Gbps in Some Cases

AT&T says it now has more than 1,040 MHz of nationwide millimeter wave spectrum after adding 786 MHz of 39-GHz spectrum in Federal Communications Commission Auction 103Prior to Auction 103, AT&T acquired 379 MHz of 39-GHz spectrum when it purchased FiberTower for $207 million in early 2018. 


That means AT&T will have 800 MHz of 5G bandwidth in some markets, enough for eight 100-MHz channels. AT&T says it can deliver up to 400 Mbps of download speed per 100-MHz channel, reaching 1.5 Gbps across four channels.


So 3 Gbps should be possible, using all eight channels. Moreover, if a 5G device can simultaneously access AT&T’s 39-GHz and 24-GHz spectrums, or the 39-GHz spectrum plus low-band  or mid-band channels, the speeds could be even higher, some believe. 


Monday, March 30, 2020

Comcast Peak Traffic up 32%

Since March 1, 2020, peak traffic on the Comcast fixed networks is up 32 percent overall and up 60 percent in some areas, Comcast says. There is a slight shift in the evening downstream peak that typically is 9 p.m. 

Since the stay-in-place orders started to hit, the evening peak has moved to between 7 p.m. and 8 p.m., while upstream peak traffic is moving from 9 p.m. to between 8 a.m. and 6 p.m. in most cities, Comcast says. 

If we read that last statistic correctly, it might imply that upstream traffic is highly variable, day to day. It might also imply that upstream traffic reaches a high level at 8 a.m. and then stays there until 6 p.m. There is not enough detail in the Comcast report to make that determination. 

Another report suggests the peak hour for upstream traffic is between 3 p.m. and 4 p,m,

Gaming downloads are up 50 percent, more for new releases. Streaming and web usatge is up 38 percent.

On the mobile network, 4G data usage actually is down 10 percent, with a 24 percent increase in mobile device connection to Wi-Fi. That makes sense if people are not traveling outside the home, and instead are connecting to their home Wi-Fi networks. 

VoIP and video conferencing usage is up 212 percent while use of virtual private networks is up 40 percent. 

Next Wave of Company Excuses (Justifiable in Some Cases) Will Be that "Covid" Caused our Revenue and Profit Hits

Retailers often blame “the weather” for missing financial targets. The next round of explanations will be “Covid-19.” Justifiably, in many cases, as governments have essentially put them out of business for a period of time yet to be determined. 

Not all business failures or shortcomings actually will have direct connection to the pandemic, though. OneWeb, which has declared bankruptcy, says Covid-19 prevented it from getting its next round of financing. I am not sure how many people really believe that. 

Low earth orbit constellations have no track record of successful and sustainable initial deployment. Literally 100 percent of early LEO ventures have eventually declared bankruptcy or failed to launch. OneWeb is the first of the current generation to fall. 

Amazon’s Project Kuiper and SpaceX arguably have deeper pockets, and that is what is needed. Very deep pockets. 

5G Customers Consume Twice the Data of 4G Users, SKT Says

The total amount of data consumption of SK Telecom 5G subscribers is about double that of usage by 4G customers, the company says.

Consumption reached 62,000 TB on average per month over the past three months (Dec. 2019 ~ Feb. 2020). During the same period, the average monthly data usage of subscribers who switched devices from LTE to 5G has increased about twofold from 14.5 GB (LTE) to 28.5 GB (5G) per person.

There are two likely explanations for the increase. First, faster speeds generally lead to higher consumption per unit of time. That was true of 4G data consumption compared to 3G, for example.  Also, 5G customers seem to be watching more video. 


Video streaming at high-definition quality requires 16.5 times the bandwidth of gaming or music streaming and 1,000 times more bandwidth than web browsing (per page). If one assumes a user moves through five pages per minute, then HD video consumes 200 times more bandwidth than web browsing. 


“SK Telecom’s 5G subscribers are found to be using media services, which generally require greater speeds and bandwidths, much more actively than LTE subscribers,” SKT says. “As of February 2020, 5G subscribers are using seven times more VR services, 3.6 times more video streaming services and 2.7 times more game apps than LTE subscribers.”

Sunday, March 29, 2020

How Has Internet Access Usage Changed Because of Coronavirus?

It is impressionistic, but with the stay-at-home measures in place, I seem to be using less than 40 megabytes of mobile data per week. Shocking. I haven’t checked fixed network consumption, but since I work from home anyhow I do not believe that usage profile has changed very much. The phone stays on Wi-Fi virtually all day now since I’m not going anywhere the Wi-Fi does not reach. 


Internet service provider Starry notes the rise of customer internet access usage between January 13 and March 20 in three Starry markets. As you might guess, the biggest jumps of at-home usage happen between 9 a.m. and 4 p.m., times when many people otherwise would be at work or school. 


Not all the at-home usage is incremental, though. Some usage that would have occurred at business or school now is reduced.

And You Thought Selling Groceries was a Low-Margin Business

Cheap computing, storage and communications are basic assumptions upon which products and business models are built these days. Our ability to commercialize millimeter wave spectrum for mass market communications hinges on the cost of signal processing, for example. Before the advent of cheap signal processing, millimeter wave communications could not be used for mass market access networks because the signals would not travel far enough to be useful. 

The same trend has been evident in storage for some time, as prices approach zero. 


The issue for retail service providers is how to sustain a business model, when, in some cases, it can be argued that the cost of supplying a gigabyte of usage is less than the revenue generated by supplying it. 

One analysis of firm profits conducted by Aswath Damodaran of New York University suggests mobile operator net profit margins are less than one percent. 


One might make similar observations for the revenue generated by voice and messaging. That, simply, is why many believe access providers must move into additional roles and segments of the internet ecosystem, as hard as that might be, despite the risk and cost. 

Date updated:
5-Jan-20
Created by:
Aswath Damodaran, adamodar@stern.nyu.edu
What is this data?
Profit margins 
Home Page:
Data website:
Companies in each industry:
Variable definitions:
Industry Name
Number of firms
Gross Margin
Net Margin
Advertising
47
25.81%
3.30%
Broadcasting
27
47.68%
29.83%
Cable TV
14
61.71%
8.55%
Computer Services
106
24.64%
4.34%
Entertainment
107
40.90%
11.73%
Heathcare Information and Technology
129
47.65%
8.90%
Information Services
69
55.53%
19.13%
Retail (Online)
70
45.25%
4.57%
Software (Entertainment)
86
64.46%
20.53%
Software (Internet)
30
62.64%
2.07%
Software (System & Application)
363
71.37%
19.54%
Telecom (Wireless)
18
57.96%
0.79%
Telecom. Equipment
91
55.74%
12.55%
Telecom. Services
67
55.71%
4.27%

It is worth noting that net profit margins in the retail grocery business are 1.44 percent, according to Damodaran. Mobile services might have slimmer margins than the notoriously thin-margin grocery business.

Saturday, March 28, 2020

What Growth Pattern after the Covid Pandemic Ends?

No question is more logical for anyone in the mobile services industry than “what happens to revenue and sales after the pandemic is contained?” There likely is no single answer, as the likely result will be a reversion to whatever trends were already in place, by firm, market and industry segment.

In other words, after perhaps a year of mild mobile service provider disruption, firms, markets and industry segments will revert to whatever trend held before the pandemic. In some developed markets, for some firms, that means a continued revenue down trend.

In developing markets, growth will resume at about the same rates as before the pandemic. In other cases, slight growth will happen, as that was the pattern before the pandemic.

Fixed markets, facing disruption even before the pandemic, will likewise revert to form, but with a higher likelihood of revenue pressure in developed markets and slight growth in developing markets.

The answers also will hinge on whether the post-pandemic trend looks like the recovery from the internet bubble in 2001 or the recovery from the great recession of 2008, both for economies in general and telecom service providers specifically. 

If the former holds, global revenue sort of plateaus for a year, then resumes an upward march. If the latter holds, then a prolonged period of lower revenue might happen. But there is a major caveat: what happens in developed markets and developing markets might well diverge. 

Developing markets might make a relatively-swift rebound after a year. Some firms, but not all,  in developed markets might see the same. On the other hand, many firms could see prolonged weakness. 

“From 2007 to 2009, many European operators’ average revenue per user dipped by more than 15 percent, and churn rates rose by the same amount for operators in both North America and Europe,” say consultants at McKinsey. 

More important is the recovery, though. And there we might see some divergence three years out. After the great recession of 2008, some firms by 2011 had recovered. Other firms a decade later had not ever returned to 2007 levels of growth. 


Much depends on which markets we look at. Growth has been faster in developing regions, and likely will be different from patterns in mature developed markets. So we might well assume that the recovery pattern will differ in those markets.

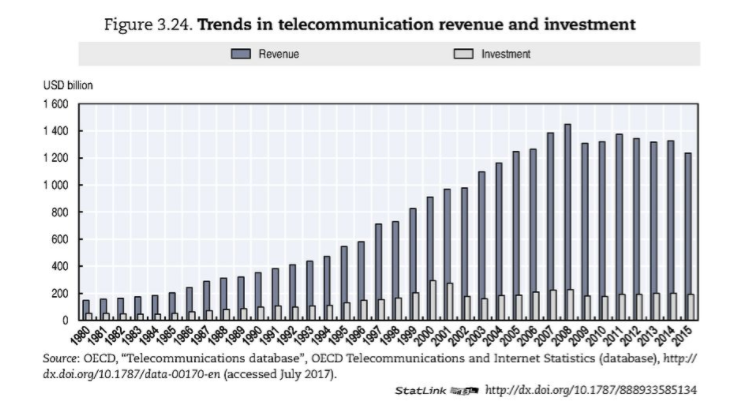
The Organization for Economic Cooperation and Development countries, on the other hand, saw only a one-year flattening of growth in the wake of the internet bubble in 2001, but saw sustained, multi-year drops in revenue after the great recession of 2008. 

So it really matters whether we believe what follows the Covid pandemic resembles the recovery from 2001 or 2008. 

In the U.S. market, for example, telecommunications revenue as a percentage of U.S. gross domestic product showed a brief slip in the wake of the collapse of the internet bubble in early 2001, but rebounded in a year. Keep in mind, this metric concerns “percent of GDP,” not absolute revenue figures. 

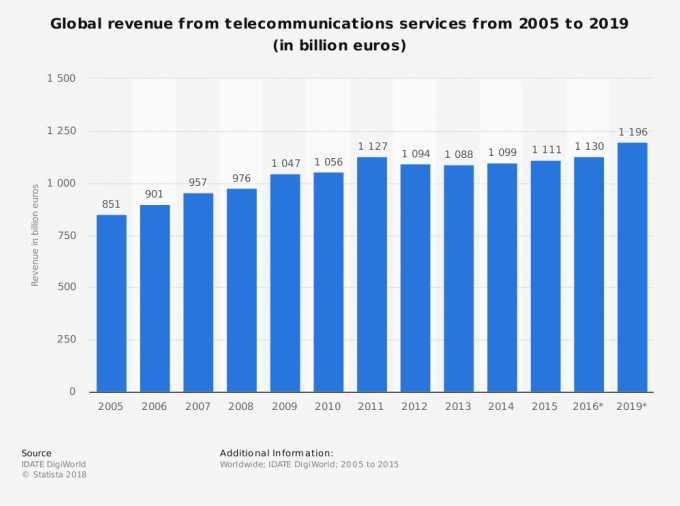
But some data suggests global revenue after 2008 was buoyed by growth in developing markets, even if developed markets did not recover. 


The disturbing possibility is a global recovery that is slower than we saw in the wake of 2008, simply because the Covid response--shutting down national economies-- will cause a recession worse than 2008, as the International Monetary Fund now expects. 

“It is now clear that we have entered a recession; as bad as or worse than in 2009,” said  Kristalina Georgieva IMF managing director. “We do project recovery in 2021–in fact there may be a sizable rebound--but only if we succeed with containing the virus--everywhere-- and prevent liquidity problems from becoming a solvency issue.”

To be sure, the health of the economy is not directly linked to the health of the connectivity industry as a whole. There is evidence that communications spending was relatively unaffected in a negative way, and only for a short period, in the recovery from 2001. 

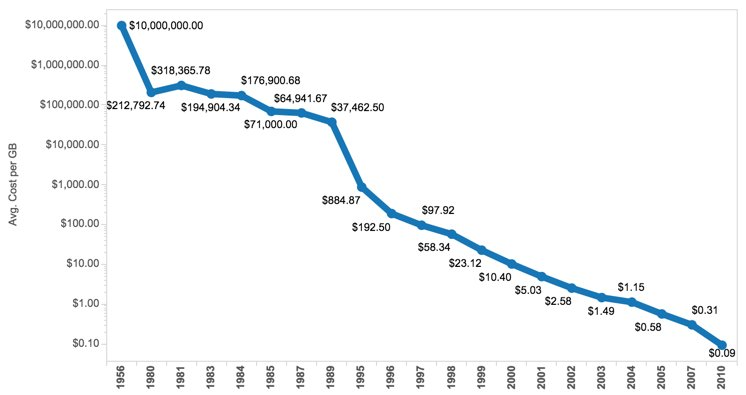
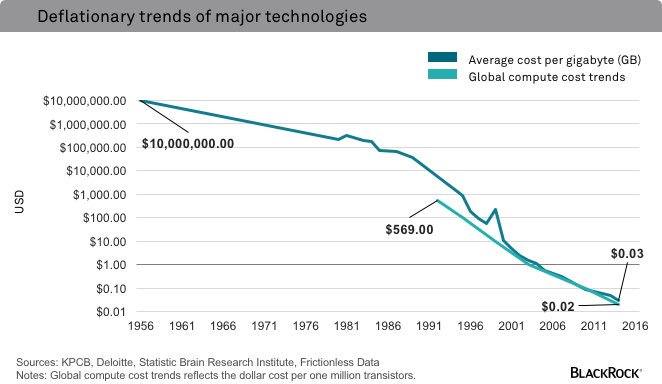
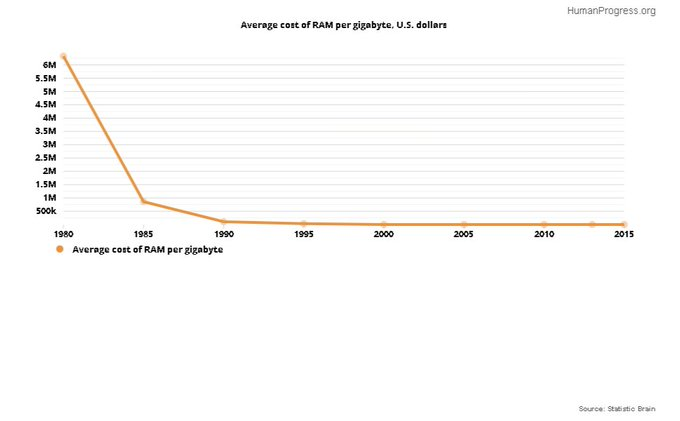
In developed nations, though, revenue seems to have dropped since 2008. But that might be explained by other issues, not the direct impact of the great recession. New product substitutes, shrinking demand for virtually all legacy products, more competition and a fall of mobile and fixed data prices might explain revenue trends since 2008 in developed nations.

If that is the case, no matter how severe the 2020 recession might be, connectivity provider revenue trends might behave in ways that predate the recession itself. 

That might include a relatively minor revenue hit in 2020, with a rapid recovery in 2021, with a stronger likelihood that happens in developing markets. Trends for many firms in developed markets have been negative since 2008, but for reasons largely unrelated to the recession itself. 

The bottom line is that there is a good chance a modest revenue impact is followed by a reversion to whatever trends were in place before the Covid-induced recession.

Is Sora an "iPhone Moment?"

Sora is OpenAI’s new cutting-edge and possibly disruptive AI model that can generate realistic videos based on textual descriptions.  Perhap...