In 2017, the average consumer unit spent $1,118 (approximately $94 a month) on cellular phone service, accounting for 82 percent of total telephone spending, or almost two percent of total household spending, according to the U.S. Bureau of Labor Statistics Consumer Expenditure Surveys.
Keep in mind that the BLS survey seems confined to "telephone" spending, and does not seem to include internet access and video subscription revenue.
Keep in mind that the BLS survey seems confined to "telephone" spending, and does not seem to include internet access and video subscription revenue.
The caveat here is that the BLS defines a “consumer unit” as families, single persons living alone or sharing a household with others but who are financially independent, or two or more unrelated persons living together who pool their income to make joint expenditure decisions.
It is a bit unclear whether we should interpret spending as “per person” or “per household.” That could make a big difference in determining how much each individual spends on mobility.
One takeaway from the data is that households are swapping mobile spending for former fixed network spending. Obviously, since fixed service is “to a place,” where mobile service is to “a person or device,” the total number of subscriptions is greater.
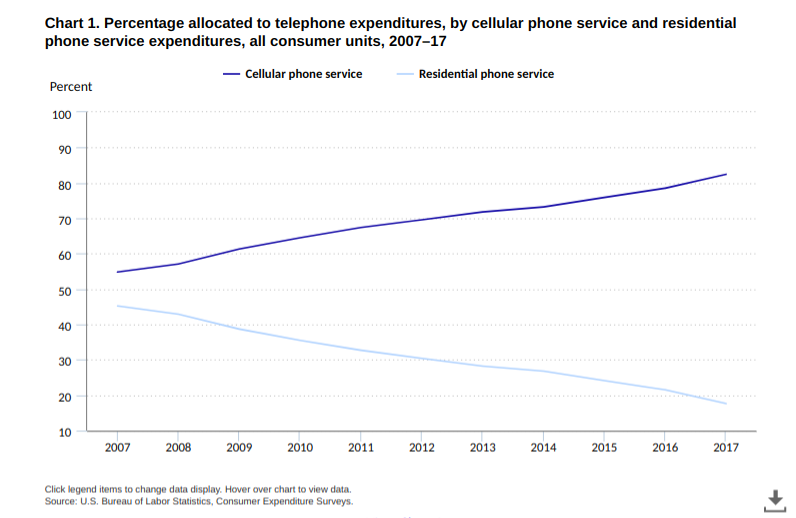
In 2007, fixed voice service represented about 45 percent of household spending on communications. By 2017, that percentage had dropped to about 18 percent of household spending on communications.
Percentage of Household Spending on Mobile, Fixed Services
| |||||||||||
Year
|
2007
|
2008
|
2009
|
2010
|
2011
|
2012
|
2013
|
2014
|
2015
|
2016
|
2017
|
Mobile phone service
|
54.8
|
57.1
|
61.3
|
64.5
|
67.4
|
69.6
|
71.8
|
73.2
|
75.9
|
78.5
|
82.4
|
Fixed phone service
|
45.2
|
42.9
|
38.7
|
35.5
|
32.7
|
30.4
|
28.2
|
26.8
|
24.1
|
21.5
|
17.6
|
Customers younger than 25 tend to spend about $725 a year on mobility services, about 94 percent of total communications spending by such persons. Customers 25 to 34 tend to spend $1139, about 93 percent of total spending.
Customers 35 to 54 tend to spend $1440 to $1492 on mobility services, representing 87 to 90 percent of spending on communications.
Age group
|
2007
|
2017
| ||
Expenditure
|
Percent share
|
Expenditure
|
Percent share
| |
Under 25 years
|
$560
|
75.3
|
$725
|
94.0
|
25–34 years
|
728
|
66.5
|
1,139
|
92.8
|
35–44 years
|
757
|
58.5
|
1,439
|
89.9
|
45–54 years
|
753
|
56.6
|
1,492
|
86.5
|
55–64 years
|
546
|
48.1
|
1,161
|
79.6
|
65 years and older
|
264
|
32.8
|
672
|
63.2
|
65–74 years
|
374
|
39.5
|
850
|
70.3
|
75 years and older
|
148
|
22.5
|
423
|
49.4
|


No comments:
Post a Comment