Wednesday, February 10, 2021

Why Mobile Consumers Often Prefer to Pay "More" Rather than "Less"

Mobile "unlimited usage" plans often cost more than alternative plans offering different amounts of data usage. But service providers and consumers seem to prefer the unlimited plans. The issue is "why?"


As a practical matter, many customers might actually save money by not buying unlimited usage plans. But consumers often value predictability more than total cost.


Dynamic pricing (price varies according to when, how or volume purchased) has been a staple of product pricing in the communications business for decades. The use of the network might be rated higher during weekdays and normal business hours, lower in off-peak periods. 


Of course, seller price methods represent cost to the buyer. In any dynamic pricing system, cost can vary based on volume of use (per-minute or per-message or per-megabyte consumed) as well as any other parameters that are dynamically applied (discounts, bundle offers, promotions). 


Dynamic pricing is touted as an advantage for buyers. “Spend less” is the attraction. That can apply both for buyer infrastructure spending (capital investment) as well as buyer operating costs (personnel costs, for example). 


When both dynamic and static (fixed cost alternatives) are available, businesses and consumers are left to evaluate the value of the options, as well as the potential cost implications. 


Quality of service also has been a driver of product pricing differentiation. Business services with QoS guarantees, support services reaction times and financial advantages for customers if the policies are violated, have been a staple of communications product pricing for decades. 


The ability to support 5G network slicing in the core network, all the way to the mobile edge, is supposed to create new product capabilities, such as networks optimized for particular parameters. 


Ultra-low latency performance; bandwidth guarantees, security or performance predictability will be touted as values of network slicing, a new way of creating virtual private networks. 


But there also are situations when dynamic pricing is not preferred by buyers. In such instances, dynamic pricing might lead to lower buy rates than fixed-rate alternatives or predictable cost alternatives, even when users face possible higher long-run costs. 


In other cases, total long-run cost also is driven by volume. High usage tends to favor a non-dynamic approach such as buying and operating “owned” infrastructure. In the unified communications as a service business, for example, high volumes mean UCaaS costs more than owning an enterprise switch. At low volumes, UCaaS costs less, and often also provides more functionality. 


Many products sold to consumers have similar trade offs. It has been the conventional wisdom in the video entertainment business for many decades that consumers prefer flat-rate buying and pricing to dynamic pricing and buying. 


Where a linear video subscription--depending on the number of channels purchased--might cost $50 to $80 a month, a streaming service--depending on which services the customer wants to buy--can start at about $7 a month each but might cost $15 a month or so.


Buying only a few pay-per-view or on-demand items a month can exceed the cost of a Disney Plus, Netflix, Prime, Hulu, HBO Max or Peacock subscription, for example. Granted, no subscription offer from any single provider ever offers “most” content, so most customers likely buy more than one streaming service. 


The point is that dynamic pricing offers the most value when a customer’s consumption is low, but offers less perceived value when consumption is moderate (possibly watching more than three movie or TV episodes a month that are purchased dynamically). 


Dynamic versus flat-rate pricing also has been an issue in the dial-up and broadband internet access eras. Take rates and time of usage have been higher in a flat-rate environment. Users faced barriers to usage in a dynamic pricing environment that affected the viability of application business models based on network effects.


Network effects depend on the sheer size of the networks. Network effects might also hinge on the likelihood of connecting with a resource in real time, as well as any latency to connect with resources. 


Phone, facsimile, email, social or other communication-based networks have little value when the total number of other users is low. So scale creates potential value. Pricing and rating affect scale, so the choice of dynamic or fixed rating also matters. 


Volume also affects appetite for either rating method. Rational buyers (business or consumer) are not going to value subscriptions or flat-rate access plans when their expected usage is episodic or otherwise very low. In such cases, dynamic or volume-based pricing should be favored, so long as the per-unit prices are low, in relation to perceived value.


High usage expectations create a better value proposition for flat-rated or subscription plans, which then offer a better per-unit or per-instance cost. 


So an ecosystem premised on network effects has incentives to use pricing plans that favor wide adoption, since many business models are contingent on scale. Advertising-based and commerce-based or transaction-based business models require volume. 


Pricing plans that encourage volume therefore are beneficial for the ecosystem. 


Early in the dial-up internet access period, AOL used per-minute pricing. Usage did not climb until that policy was abandoned and an unlimited usage alternative became standard. In the days of metered use customers only stayed online about 10 minutes a day.  


In 1992 AOL had a total of about 200,000 subscribers, using a metered usage approach. By the end of 1993 AOL had grown to about 500,000 customers. By August 1994 AOL had grown to about a million subscribers, and had roughly doubled every year since 1992. 


By December 1994 AOL had jumped to 1.5 million subscribers, growing to four million a year later (November 1995).  


In December 1996 it switched to unlimited usage, peaking about 2002 with more than 25 million members. The point is that customers really preferred fixed and predictable pricing, as it eliminated uncertainty. 


Over time, a wider range of connectivity products also have been repositioned with pricing models that are akin to subscriptions, effectively or actually subscriptions. In many markets, mobile customers have unlimited use of domestic market text messaging or voice, with no per-minute or per-message additional charges. 


Veterans of the entertainment video business might agree that the power of consumer fixed-price subscriptions is predictability. That same argument might apply to electricity or water billing that averages the monthly recurring payments over a 12-month period where consumption varies significantly between winter and summer. 


There are differences, however. Light users might still prefer dynamic pricing. Heavy users almost always benefit from flat-rate or subscription pricing. 


The relative cost burden also matters. Cost of ownership or cost of use matters less when the items represent a small percentage of overall spending or value. 


Higher-income households spend relatively little income, percentage wise, on communications or video entertainment, in general. In fact, U.S. households with annual incomes between $100,000 and $149,000 spend most of their communications budget on mobile devices and services. So the actual pricing mechanism matters less than for lower-income households, where communications spending represents a higher percentage of discretionary spending. 

source: fourtheconomy.com 


Mobile virtual network operators often make a living based on their ability to serve low-usage, low-feature-requirement or cost-conscious segments of the market. 


Spending over time also is affected by general price level trends (inflation) as well as product substitution and technological improvements. 


U.S. household spending on communications arguably has grown since 1990, but remains flat as a percentage of household income, with a fixed component (connectivity services) and a variable component (devices and a la carte content purchases). 


In many cases, product substitution also has happened. Households spend much more on mobile services and internet access, but have compensated by dropping fixed network voice services. In the same way, households substitute lower-cost streaming services for linear video packages, or reduce their spending on linear packages to create room for streaming alternatives. 


At the same time, price declines for mobile service and the ability to use Wi-Fi for network connection also have allowed use of more devices per household. Though the conventional wisdom is that the cost of internet access has increased for some decades, real prices have declined, accounting for inflation and consumption.  


Is U.S. internet access too expensive? Maybe not. According to a new analysis by NetCredit, which shows U.S. consumers spending about 0.16 percent of income on internet access, “making it the most affordable broadband in North America,” says NetCredit.  


In Europe, a majority of consumers pay less than one percent of their average wages to get broadband access, NetCredit says. In Singapore, Hong Kong, New Zealand and Japan,  10 Mbps service costs between 0.15 percent and 0.28 percent of income.


A normalization technique used by the International Telecommunications Union is to attempt to compare prices to gross national income per person, or to adjust posted retail prices using a purchasing power parity method. 


There are methodological issues. Gross national income is not household income, and per-capita measures might not always be the best way to compare prices, income or other metrics. But at a high level, measuring prices as a percentage of income provides some relative measure of affordability. 


Looking at internet access prices using the PPP method, developed nation prices are around $35 to $40 a month. In absolute terms, developed nation prices are less than $30 a month. 


The average global price of a fixed network internet access connection is $73 a month. So average U.S. prices are significantly lower than the global average. 


The point is that consumers and businesses often prefer not to buy services or products that are priced dynamically, and prefer flat-rated or fixed-rate product alternatives. 


Overall, home entertainment video revenue is dominated by subscriptions not discrete purchases of content globally. That applies both to linear and video streaming revenue. 


In a sense, a subscription is a fixed-price contract, providing certainty of cost. The disadvantage is a loss of flexibility, but buyers seem to see value in the price or cost certainty.

Monday, February 8, 2021

80/20 Rule for New Telecom Lines of Business

The 80/20 rule applies broadly in nature as well as business, including the connectivity business, and especially to revenue and profits. Notably, no matter how important the new internet of things revenues or edge computing might be, most of the revenue and most of the profit still will be generated from the basic consumer and business customer connectivity services. 


It remains unclear how the balance of incremental new revenues will shape up for various service providers, but it might in many cases still be the traditional or legacy sources that bring the volume. The leading mobile and fixed network service providers are likely to find that both incremental new revenues and profits are higher in traditional lines of business than new lines of business. 


One would expect that to be the case for some time, given the immense size of legacy revenue streams, ranging from mobile service or fixed access in general to specific components such as mobile or fixed internet access. 


The installed base is so large that small percentage increases produce large sums. In new lines of business, even large growth rates still produce small revenue volumes. 


Assume that U.S. IoT service provider revenues from all participation in internet of things services and products amounts to less than $1 billion in the U.S. market in 2021. Assume U.S. connectivity service providers make about $420 billion in annual revenues. One percent lift in those revenues equates to about $4.2 billion in incremental revenue.


In other words, the revenue boost from generating one percent more revenue from legacy lines of business is four times the contribution from IoT, if one assumes IoT is even a $1 billion business at the moment. 


To be sure, the amount of IoT connectivity revenue will grow. Still, the 80/20 rule will apply. Legacy connectivity (including entertainment revenues) services will still constitute the bulk of total revenues and likely also profit. 


It is hard to see how profit margins on IoT services will be anywhere close to those of broadband internet access--mobile or fixed--voice services, messaging or even entertainment video.


Saturday, February 6, 2021

Speed Still Tops 5G Coverage as a Buying Criteria, RootMetrics Finds

Speed still seems a more-important buying criteria than speed, for mobile customers, at least when the choices are data speeds or availability of 5G service.  That goes for business and consumer users, according to RootMetrics.


source: RootMetrics 


On the other hand, 5G availability is becoming a more important buying criteria. 


Keep in mind that AT&T continues to rely on low-band spectrum for its coverage 5G, while Verizon uses dynamic spectrum sharing of mid-band capacity, while T-Mobile relies on low-band, but is adding lots of mid-band assets as it combines its network with those of the former Sprint. All three firms are using millimeter wave for capacity reinforcement at the moment.


Verizon seems to be best positioned to add licensed Citizens Broadband Radio Service 3.5-GHZ capacity to its network, in part because it already had been using unlicensed CBRS in parts of its network already. 


It might be a year before the new C-band capacity starts to operate commercially. So expect lots of constant change in speeds and coverage of those speed tiers, as the network evolutions continue.


Wednesday, February 3, 2021

C-Band is Table Stakes for 5G

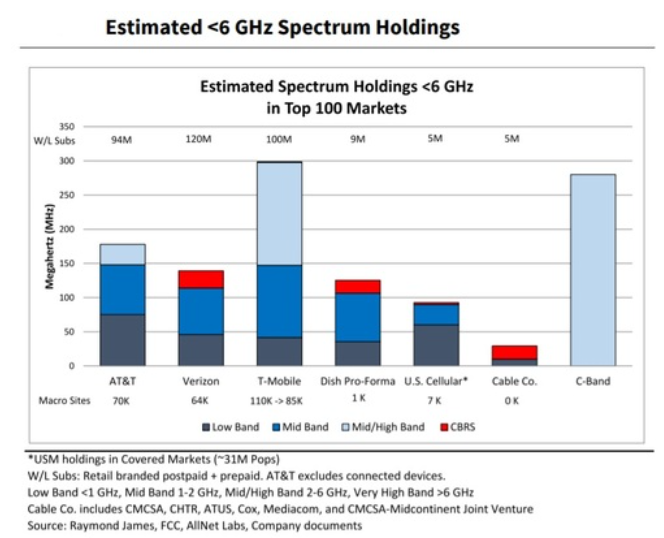
Ignoring for the moment access to the millimeter wave spectrum, the impact of the U.S. C-band auction of 280 MHz spectrum is considerable and likely foundational for U.S. 5G prospects. The reason is simply that the mid-band spectrum offers the best combination of 5G coverage and capacity gains. 


In fact, the C-band auction alone dramatically boosts the amount of mid-band spectrum available to U.S. mobile operators. The 2020 Citizens Broadband Radio Service auction brought about 70 MHz of new mid-band spectrum to bear. The C-band auction adds four times that amount. 


C-band now adds nearly the equivalent of the capacity possessed by T-Mobile, the clear leader in terms of amount of mid-band spectrum. 

source: Raymond James 


While mid-band spectrum (2 GHz up to 6 GHz) does not offer the order of magnitude capacity and speed increases of millimeter wave spectrum, it does support faster provisioning of nationwide coverage at reasonable cost and also demonstrable speed and capacity gains over 4G. 


The reason is simply that mid-band signals propagate much further than millimeter wave signals, often allowing co-location of 5G radios at existing 4G sites, for example. Mid-band signals also can use the existing macrocell architecture, rather than requiring a whole new small cell network to be built. 


That has infrastructure costs, as small cell networks require new radio locations and dense optical fiber backhaul networks, with associated real estate, capital investment and installation costs.


Many will worry about the added debt burden (more than $81 billion and possibly as high as $91 billion after existing users are cleared) as firms pay for their licenses. That noted, licensed spectrum is the foundation for mobile operator business models at scale. Failure to win additional C-band spectrum could be fatal for all suppliers except T-Mobile. 


C-band assets are expensive, to be sure. But they also are necessary table stakes for would-be 5G market share leaders.


Tuesday, February 2, 2021

Mobile-First or Wi-Fi-First Consumption Modes?

India provides a good illustration of how internet access patterns are shaped by available infrastructure. India has very-low prices, compared to the United States, and very high mobile data usage, compared to the United States.


source: Benedict Evans 


One might explain that disparity by noting that mobile internet access is the way most people in India use the internet. In the U.S. market, there is more reliance on fixed network broadband. 


In India, about 98 percent of total internet access uses a mobile device. Globally, mobile users consume as much as 60 percent of total data on fixed networks (Wi-Fi).


In recent years, U.S. mobile customers have spent about half their connected time on Wi-Fi (fixed network), not the mobile network. By 2023, U.S. mobile users might offload as much as 75 percent of data consumption to fixed networks. Much hinges on how consumers behave when they have unlimited usage plans, which might reduce Wi-Fi consumption. 


source: Cisco, WiFiForward

Monday, February 1, 2021

History Suggests 5G Value Primarily Will Come from New Apps and Value, Not Access Per Se

If we have learned anything at all about consumer interest in buying broadband internet access, it is that compelling application experiences create the demand for access. 5G might well be different from 3G or 4G if the compelling new use cases arise in the business segments of the market, not the consumer markets. 


So far, in business markets, fixed network substitution has been a minor use case for 4G. Many believe fixed wireless substitution will be a bigger use case in the 5G era, especially as millimeter wave access becomes more common. 


It would be fair to note that expectations are high for internet of things (including vehicle apps, factory automation, smart cities) and edge computing use cases, for example, plus virtual networks. 


Some might note that if all or most of the new use cases are for enterprise users, 5G might prove relatively unprofitable, since consumer revenues still account for the majority of mobile use cases and revenue. In that sense, it will be important that new consumer use cases and revenue are found. 


Though faster access speeds have some value for consumer users, the big surge of consumer 5G uptake is likely to come for one of two reasons. 


The first is that marketing plans offer value of some sort not directly dependent on 5G. In the U.S. market, 5G is available from some mobile operators as a feature of unlimited usage plans, for example. 


Long term, compelling applications are likely to create the sustainable 5G demand. Anecdotally, I can remember the day 4G smartphones became truly useful. As a traveling worker, the ability to tether to 4G for using my PC was compelling. 


As a mobile device, 4G became valuable when Google Maps offered “no additional fee” turn-by-turn navigation, obviating the need for a separate Garmin GPS device with an attached recurring subscription.


Later, Uber, Lyft and ridesharing added more value, building on Google Maps. For some consumers mobile entertainment video might have been the value driver, though not in my case. 


On occasion, device demand also has changed because some new use case became compelling. Many business users could tell you they chose to use a Research in Motion BlackBerry in the 3G era because it offered the best mobile email experience.


Many of those same users might also tell you they switched away to other devices that provided a better web experience. That arguably was true both of moves away from BlackBerry and the Nokia Symbian operating system precisely because web browsing had become the crucial use case, not email access. 


Application bundling will be tried in many markets, with differing chances of success. But bundled or not, app stores mean the key driver is compelling third party apps. And we likely do not yet know what those apps and use cases might turn out to be. 


So far, I have not found any new killer app of the “turn-by-turn navigation” sort that suddenly makes the case for 5G drop dead simple.


And though it is a short-term issue, the work from home restrictions have effectively reduced my use of mobile data, roaming and the requirement for speed, as most of my mobile usage now is simply supplied by at-home Wi-Fi. 


At least for the moment, unlimited mobile usage adds very little value, as none of the devices on my shared account use much mobile data. Access speed also matters little when out-of-home demand has been so much reduced. Nor does lower latency have any obvious compelling new value, for the same reasons. What works fine on at-home Wi-Fi--which is every app I actually use--is sufficient on a 4G network. 


That is not to say new use cases are impossible or unlikely. Mobile email was among the important new use cases for 3G. Turn-by-turn directions were key for 4G. Something will happen in the 5G era, even if we cannot precisely say what the new value drivers will be. 


That uncertainty has been true for fixed network use cases as well.  


Millimeter Wave Spectrum Economics are Different

Millimeter wave spectrum prices differ markedly from low-band or mid-band spectrum, partly because of the propagation characteristics and partly because capacity per MegaHertz is so different from either low-band or mid-band spectrum. 


Consider mid-band prices. Where recent U.S. C-band spectrum prices had an average national price of $0.94 per MHz-POP, millimeter wave prices in various countries have been in the range of cents per MHz-POP. 


After expected clearing costs, the U.S. C-band average price might reach $1.09 per MHz-POP. 

source: GSA 


C-band prices in other auctions also have been generally higher than for millimeter wave assets.

source: GSA 


Signal propagation differences--millimeter wave signals do not propagate as well as low-band or mid-band signals, requiring use of small cells and therefore implying higher infrastructure costs. To make the millimeter wave business model work, operators must pay less for the spectrum to offset the higher infrastructure costs. 


The other issue is simply the amount of capacity that millimeter wave represents, essentially representing a volume buy, compared to low-band and mid-band assets. Where low-band spectrum might have represented a total capacity of just 10s of MegaHertz in any single auction, millimeter wave allocations often represent hundreds of MegaHertz to a GigaHertz or more of capacity. 


The point is that licensed millimeter wave asset pricing is on a different scale than low-band or mid-band spectrum. 

source: Socratic.org 


That is true despite the fact that millimeter wave capacity is so much higher than low-band or mid-band frequencies. The basic concept is that the higher the frequency, the higher the bandwidth. 


The bandwidth of a signal is the difference between the upper and lower frequencies. And that is where frequency really matters. A 20-MHz channel at any frequency is “the same” in terms of channel size. 

source: Wikipedia 


But potential bandwidth varies by frequency, within any channel, simply because higher-frequency signals have more oscillations per unit of time than low-frequency signals, and hence more opportunities to code information in a unit of time. 


Assume the simplest case of coding information where each oscillation of a wave includes a +1 and a -1 state, the +1 state corresponding to a “one” and the -1 state corresponding to “zero.” 


Low-frequency waves (low-band mobile signals, for example) simply have fewer +1 to -1 transitions in any unit of time. Millimeter waves, with much-higher oscillation rates, have many more +1 to -1 transitions in any unit of time. And that means more symbols can be coded in any unit of time, which means higher symbol transmission rates, and therefore higher bandwidth. 


Standards also make a difference, as 5G millimeter wave channels are potentially larger. Channels in 4G are set at a maximum of 20 MHz. LTE-A allows channels of 100 MHz. Compare that to 5G  channels which can range up to 500 MHz. The wider the channel, the more bandwidth per channel. 


Modulation also matters. More-complex modulation systems are capable of coding multiple bits per Hertz, rather than a single bit per Hertz. 

source: Waveform.com 


The recent U.S. C-band auction drew record bid amounts. But that is partly because it also represented a huge block of spectrum, roughly four times the amount of spectrum offered in the crucial AWS-3 auction that was a mainstay for U.S. 4G, as well as four times the amount of capacity made available in the recent 2020 Citizens Broadband Radio Service auction, both of which were on a new scale for mobile spectrum auctions.  


Going forward to a future where future mobile platforms will rely on new millimeter wave spectrum, we will have to adjust to pricing metrics that are different quantitatively and qualitatively from low-band and mid-band economics.


Is Sora an "iPhone Moment?"

Sora is OpenAI’s new cutting-edge and possibly disruptive AI model that can generate realistic videos based on textual descriptions.  Perhap...