Wednesday, November 10, 2021

5G Fixed Wireless: How Big a Market?

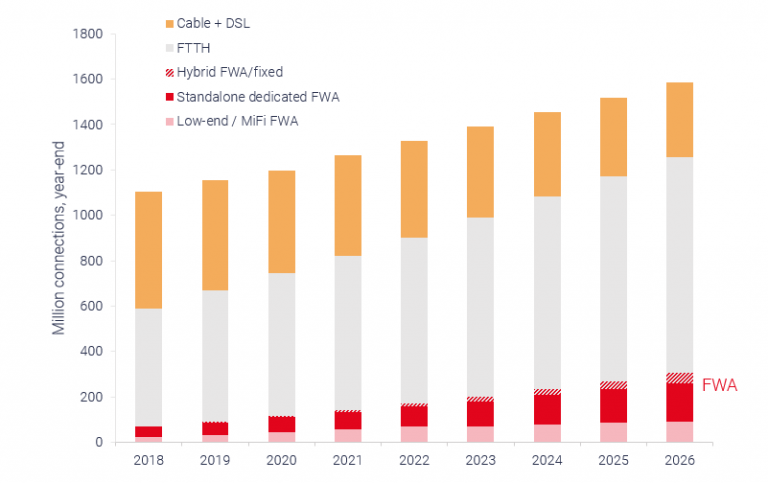
Fixed wireless using 5G will by 2026 support 180 million connections globally and generate US$70 billion in revenue, accounting for 40 percent  of the total fixed wireless access market, according to ABI Research. 


Some believe subscriptions could be substantially higher, though. 


Adoption likely will be highest in markets where the cost of deploying fiber to home or hybrid fiber coax remains unworkable, and where demand for moderate-speed internet access is high. Some might argue that 5G fixed wireless is most directly the successor for 4G fixed wireless and digital subscriber line. In some markets that opportunity might last for a substantial amount of time.

source: STL Partners 


In other markets there might be a window of opportunity that essentially closes within a decade, as cabled network capabilities continue to improve with faster fiber to home deployment and upgrades of hybrid fiber coax networks. 


Some portion of the opportunity, in some markets, will remain as a platform for “out of region” by mobile operators who are able to compete for some portion of the home broadband market, especially customers who only want to buy moderate-speed services at lower prices. 


The adoption forecast arguably is more difficult in markets where high rates of FTTH deployment or HFC are expected and where demand for gigabit per second speeds is robust. In such cases, 5G fixed wireless will be most-often adopted as an “out of region” strategy by mobile operators  to compete with fixed network suppliers. 


A decade from now, we might see that 5G fixed wireless expands its share of the installed base, compared to other access platforms. But as with satellite access, the market might remain a fraction of the total addressable audience. 


Each new generation of satellite services has continued to appeal to the same potential customers: rural dwellers in areas where it is difficult to build cabled networks. That remains a low single-digit opportunity. Low earth orbit constellations will bring higher speeds and lower latency, but speeds and latency performance are increasing across the board, on every platform.


There is little reason to believe the relative market shares or installed base of home broadband customers gotten by satellite providers will change very much as the LEO constellations reach full commercialization. 


Fixed wireless, on the other hand, should appeal to a wider audience of customers presently only able to buy copper fixed network service. And even that market window will narrow as more ISP FTTH connections are added, replacing copper. 


Also, in some markets, where HFC networks are ubiquitous, it seems unlikely that 5G fixed wireless can keep pace with the next generation of HFC internet access, which will enable speeds up to 10 Gbps.


So Far, 5G Structural Separation Is Not Popular

Sometimes a single fixed network is all a country can reasonably afford to support, leading to regulatory policies formally based on a single infrastructure supplier and multiple retail providers. Sometimes it works better; possibly sometimes worse than allowing infrastructure competition. 


Malaysia's government 5G network--at least for the moment--seems an example of that. The biggest mobile service providers--Axiata Group, DiGi.com and Maxis--who prefer to build and operate their own networks, have not yet agreed to use the government’s network, though the network is preparing for launch in about a month.


At least up to this point, mobile networks have not been unaffordable in markets with competition. Indeed the top Malaysian carriers already had been making investments to support 5G. 


Among the stated worries are prices, the ability to innovate or differentiate, as well as transparency. Mexico pursued a similar single-5G network approach, but that failed because of mobile operator opposition. 


As more private equity and institutional investment funds ponder taking stakes in digital infrastructure assets--including access networks, data centers and fiber backbone assets--we will have to see where the operator comfort level lies. Few have fundamental qualms about divesting tower assets. 


The issue is how much broader involvement in entire core or access assets could occur. Traditionally, private equity investments  have been concentrated elsewhere, especially in real estate, energy assets, business services and software. But telecom infrastructure investments have been growing. 


That noted, the top-down government mandate approach to structural separation seems problematic. Malaysia and Mexico chose a govertnment-imposed structural separation model. 

The newer investment-sharing model relies on voluntary, market-based investment in core access or transport infrastructure, or telecom real estate. That can involve either purchase of minority stakes in whole businesses, or outright acquisition of whole businesses. 

There seems, as you might guess, less interest in structural separation than in co-investment; less interest in facilities-light operations than burden sharing of capital investment. 

Monday, November 8, 2021

Higher ARPU from Mobile Speed Tiers, On-Demand Access?

Mobile operators hope network slicing emerges as a a key enabler of new mobile service plans, adding both on-demand, dynamic service levels and pricing, plus speed tiers similar to those offered by fixed network providers. 


Traditionally, mobile service plans have been differentiated by usage allowances, not speed. But the virtualized 5G core network can support the creation of end-to-end virtual networks that might be differentiated on a number of performance metrics.


Among the possible changes are speed-guaranteed tiers of service, or services featuring quality of service related to latency. 


That would, in principle, allow mobile operators to offer speed tiers similar to those offered by fixed network internet service providers. Where today mobile services are differentiated by usage allowances, in the future network slicing could enable differentiation by speed tiers. 


Elisa, a Finnish telco, reports that customer-satisfaction scores are around 50 percent higher for customers whose plans afford them speeds of greater than 300 Mbps, compared with those with plans offering less than 100 Mbps, a McKinsey survey suggests.


To be sure, nary an innovation in the mobile business related to any next-generation network fails to elicit a hope that consumers will pay more for some new feature. Such hopes often do not materialize. 


McKinsey believes ARPU lift ranging from five percent to 10 percent is possible simply based on faster 5G speeds, even if offered only on a “best effort” basis. Perhaps a more-realistic expectation is possible three percent to six percent ARPU lift. 


 source: McKinsey 


Further, McKinsey consultants also believe additional ARPU lift of perhaps three percent to six percent in average revenue per user is possible if on-demand features also are offered, such as on-demand and temporary boosts in speed or perhaps latency. 


That might arguably be true for a subset of customers, typically the highest-yielding accounts, for example. 


For example, if a customer needs stronger connectivity to stream a video, play an interactive game, or make an important phone call, they can simply press a button, pay $1 to $2, and receive a temporary performance boost, McKinsey argues.


Spectrum License Portion of Total Capex is Growing

As the U.S. spectrum auction of 3.4-GHz spectrum nears an end, $22 billion already has been bid on those assets, with an average price per MegaHertz per person of about 65 cents. Some will argue that directly increases capital investment by the winning entities. Others will agree, but enumerate those investments separately from other mobile operator capex. 


How much capital investment mobile operators invest each year depends on how one counts such investments. Often, physical plant and spectrum investments are tallied separately. 


Consider a CTIA report on U.S. mobile industry capital investment. Between 2016 and 2020, for example, “capex” is said to range from $25 billion to $30 billion per year. 


source: CTIA


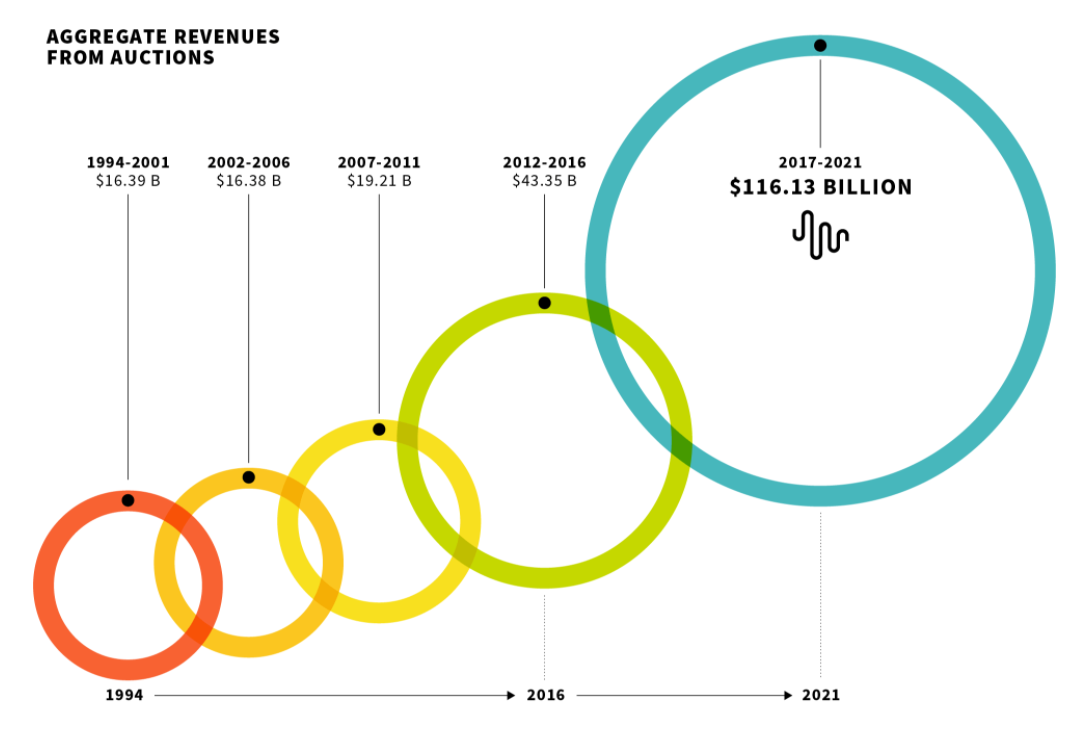
Spending for spectrum licenses ranges is tracked separately, it appears, as it appears spectrum license spending has accelerated since 1994. 


Prior to 1994, spectrum license spending might have been tracked by decade. Between 1994 and 2001 CTIA used an eight-year interval. Since 2002 CTIA uses a five-year interval. 


That indicates a quickening of the tempo of license acquisitions; more competition for licenses as well as bigger spectrum allotments (more frequent auctions; more licensees; more capacity per auction). 

source: CTIA 


It appears CTIA, for purposes of tracking capital investment, does not include spectrum purchases in its chart on U.S. mobile industry “capital investment.” CTIA shows cumulative “capex” between 2016 and 2020 as a cumulative $138.5 billion total. 


CTIA also shows spectrum licenses paid for in the 2017 to 2021 period as $116 billion. So obviously, spectrum license spending, though “capex” for accounting purposes, is separated from spending on spectrum licenses, which also is categorized as “capex” by accountants. 


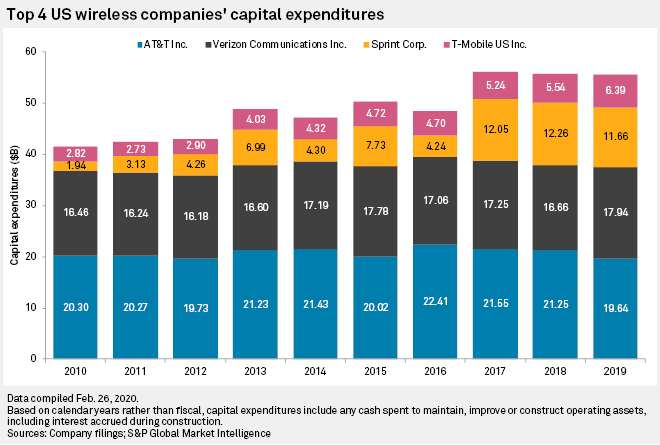
Standard and Poors includes spectrum licenses in the “capex” category, for example.  


So actual mobile capex often is portrayed as higher or lower, depending on the assumptions. “Network capex” often is separately portrayed from “spectrum capex.” Both have grown. 


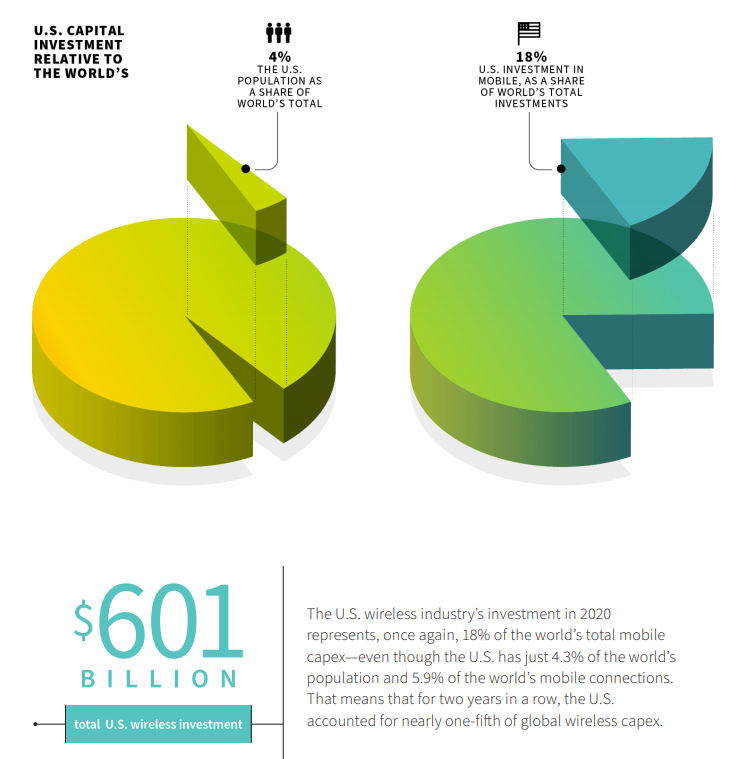
CTIA also says cumulative capex including 2001 to 2020 is $601 billion, an average of about $30 billion per year. That tends to correlate to separate tracking of network capex and spectrum license capex. At the same time, cumulative spectrum license fees are said to represent a cumulative $200 billion in spending.   


Spectrum licenses represent perhaps 25 to 35 percent of mobile operator assets in the United States and perhaps 10 percent to 20 percent of assets for other mobile operators globally.  


Overall, some might argue that total capex is rising. This chart from Standard and Poors Market Intelligence shows U.S. mobile operator capex (Just the three largest facilities-based providers) rising over time. As S&P includes spectrum spending in capex totals, that suggests spectrum spending is rising. 


source: Standard and Poors 


But secondary transactions also happen. Including those investments, U.S. mobile operators have cumulatively spent about $601 billion in capital investment since 1994, according to the CTIA.


Spectrum license purchases since 1994 have amounted to at least $211.5 billion, not including the cost of spectrum licenses that have traded hands in the form of direct purchases or company acquisitions and mergers. 


Assume that about half of all spectrum originally acquired at auction then is resold on secondary markets, primarily as firms with those licenses are acquired by other firms. That would imply an additional $106 billion that mobile operators have spent on spectrum assets. 


source: CTIA 


If so, then spectrum represents about $317.5 billion in spectrum capex, or roughly 53 percent of total capex.


Tuesday, November 2, 2021

Mobile Operators Necessarily Will Use Cloud-Based 5G Networks

5G Security and More

5G is Progressing at Least as Fast as 4G

Despite some criticism of 5G value at the moment, 5G subscriptions are on a growth trajectory that seems at least the equal of 4G and arguably is happening faster. And most forecasts fast 5G adoption compared to 3G, for example, on the model of 4G, which also was adopted faster than 3G.  

source: Jha, Saha


There is much more debate about new revenue opportunities that might develop--or should develop--in the 5G era. But that is not unexpected, either. It takes time--three to five years--to fully build out a new next-generation network in a continent-sized country. 


Only once that is accomplished can application developers assume that a certain baseline of capability exists. So app development takes longer than network deployment, which itself takes up to half a decade to reach ubiquity. 


Important new use cases develop on an S curve patten, which means progress always is slower at first, compared to expectations, but then greater than expected, once the inflection point is passed. 


That pattern of overestimating early adoption, and underestimating longer-term impact, is quite common for technology products. 


We see less change than expected early on, but more change than we expected later on. So we face early disappointment and then extrapolate into the future at a “slow change” expected rate. But successful innovations then wildly exceed our expectations. 


source: InvestorPlace 


We still are likely to be surprised by how people and organizations take advantage of either 5G or 6G. Nobody expected text messaging to become a big hit in the 2G era. 


Nobody expected 4G smart phones to create a new ridesharing industry, as few probably saw the impact of turn-by-turn navigation apps as 4G launched. 


What we initially expect is the blue line, shown below. What we actually experience is the red line. Less than we expected at first, more than we expected longer term. 


source: PartSolutions 


Consider that pattern a consequence of Martec's Law, which states that technological change is exponential, while human organization change is linear. One practical implication is that humans can predict vast changes, which seem stubbornly slow to develop. So we overestimate the early impact. 


source: chiefmartec


Then disillusionment sets in, and we discount the potential impact, as we do not seem to reap the expected benefits. Then, at some point, there is a catalyst, or a change in adoption rates, that shifts behavior beyond the incremental pace we had come to expect. 


That would help explain the “less change than you expect early, more impact than you expect later” phenomenon. 


As humans change in a linear way, so our expectations about the future oscillate between  overly-optimistic early expectations and linear extrapolations when big changes are not seen early on. 


source: Medium 


Is Sora an "iPhone Moment?"

Sora is OpenAI’s new cutting-edge and possibly disruptive AI model that can generate realistic videos based on textual descriptions.  Perhap...